
Traffic Simulator
Pulls real city roads from OpenStreetMap and drives thousands of cars over them to test signal strategies
2,749lanes in a 4.2 km² central Tel Aviv model
The problem
"Would smarter traffic lights help here?" is a question with an obvious shape and no easy answer. Real trials are slow and expensive. The serious simulation packages are desktop software with a learning curve measured in weeks. And an eyeball comparison of two runs proves nothing, because traffic is noisy enough that any two runs differ.
What I built
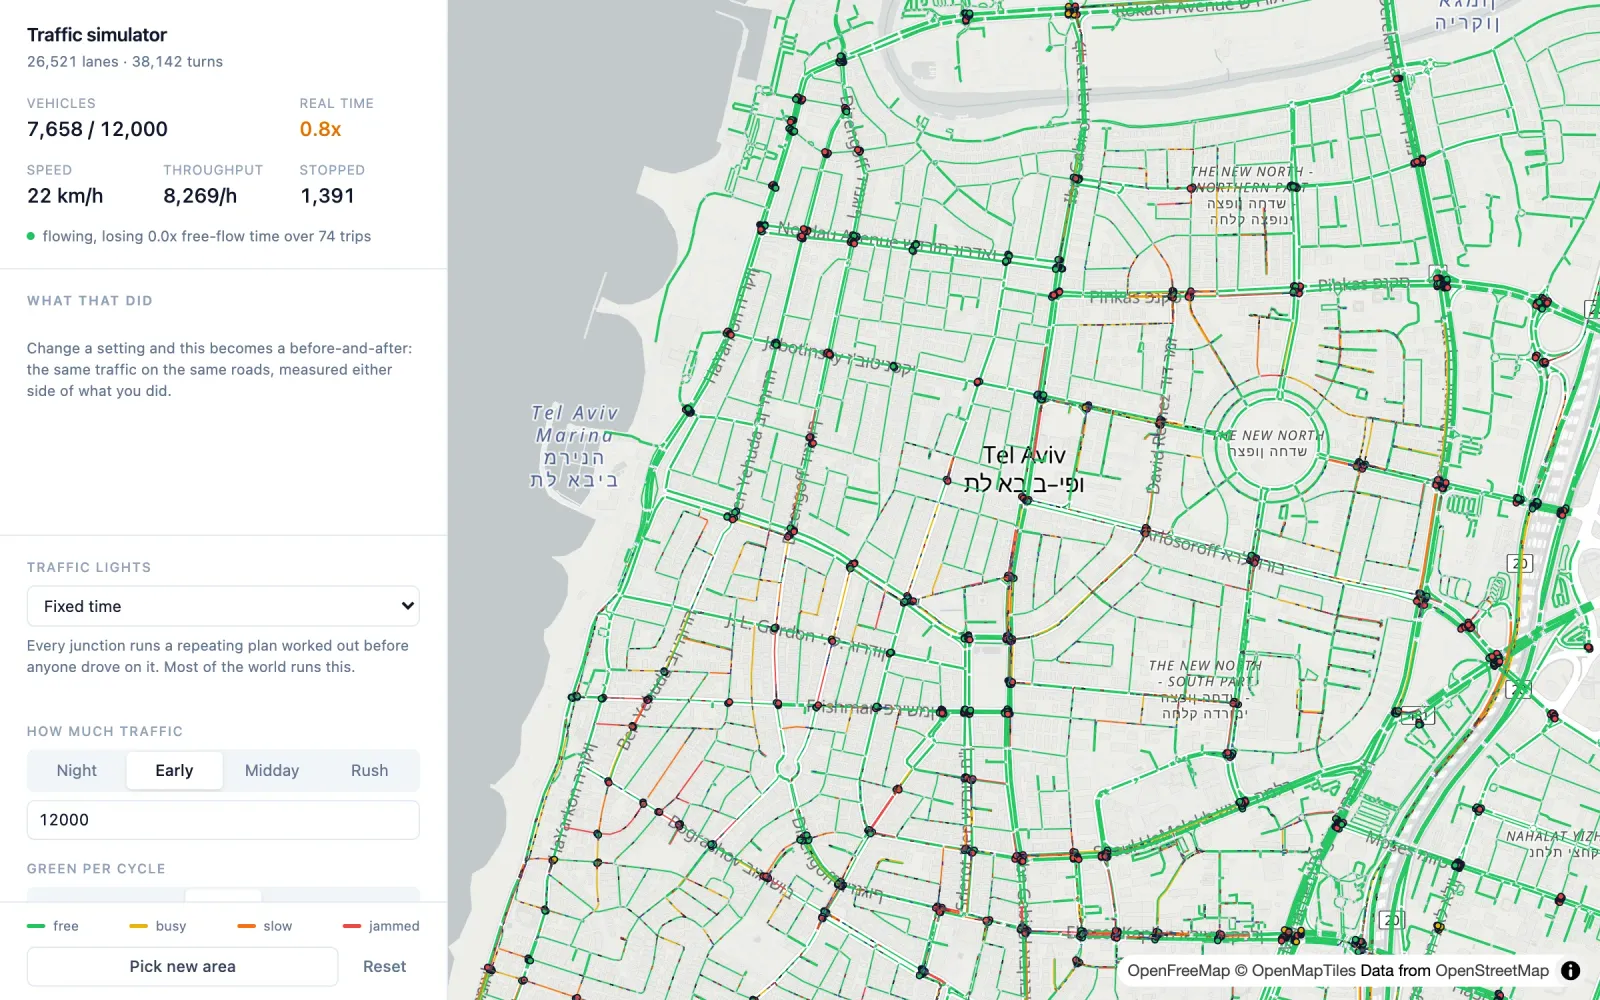
Pan to anywhere in the world, press one button, and it pulls the road network from OpenStreetMap, expands it into individual lanes and junction movements, and drives cars over it. No API key, no install, nothing to configure. Central Tel Aviv comes out as 26,521 lanes and 38,142 turning movements.
Roads recolour by how held up traffic on them is, so a change reads as a corridor going from red to green rather than as a number moving. Change the light strategy or the traffic level and the panel shows the figures from before the change beside the ones since it.
What makes the model worth trusting
- Each direction of a street is its own set of lanes, offset to the driving side of the centreline, so opposing traffic is genuinely apart rather than drawn apart.
- Intersections are not points. Every permitted movement through one is a curved link with real length, so crossing a junction takes time and can be checked for conflicts.
- Vehicles look ahead across link boundaries, not only along the road they are on, which is what lets a queue back up through a junction instead of vanishing at its edge.
- Signals are phased from the real conflict list, not from opposing bearings. A turn may run on the same green as the traffic it crosses provided it gives way, which is what a real signal does and what keeps a crossroads at two phases instead of four. Junctions that the map models as several nodes, which is most large ones, are planned as one junction on one cycle.
- Every run is repeatable. Give it the same roads, traffic, light strategy and random seed, and you get the same result. The browser clock and interface cannot change it.
Drawing it
The road network is drawn on a real map. Cars are simple shapes drawn together in one fast pass, because at the zoom where you actually watch traffic, each car is only a few pixels.
The shader's precision behaviour is asserted in plain Node with Math.fround, which is exactly what a GPU does to a float, so the vehicle layer is covered by tests that need no browser at all.
The harness is the point
The panel shows one run. That is enough to see what a change does and nowhere near enough to prove it. So a separate test runs strategies against each other across traffic levels and random seeds, then ranks them while marking results it could not tell apart.
Six strategies ship and only four are proposals. The other two are bounds: random spends exactly the same total green as the fixed plan and only reorders it, so anything worth running has to beat it, and all-green is unreachable and measures what the signals cost in total.
A policy sees detector readings and nothing else. It is never allowed near the vehicle array and is never asked about the yellow or the all-red clearance, because a strategy that won by shortening a clearance would be winning by running the junction unsafely and the harness would happily report that as an improvement.
The report is also willing to say it does not believe itself. A run where some replications were still filling the network at the end of warm-up prints a warning above the results table telling you to raise the warm-up and run it again before quoting anything below. Both of my current lineup runs carry that warning, which is why there is no headline percentage on this page.